September
16
Graphs
This week for maths, we have been drawing graphs for the 5H birthdays. I drew a graph for 5H birthdays for each month label the y axis and the x axis. To improve, I think I could of used a ruler and colour in better. This is my first one.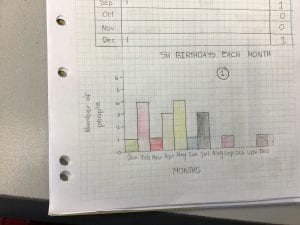
For my second one, I used a ruler and I coloured in the rectangles better. The data is still the same but I made it better.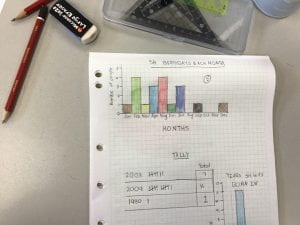
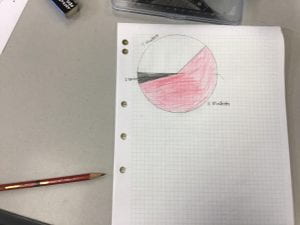
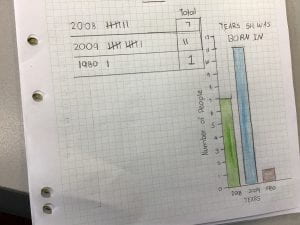
After that, I decided to find out what years were people born in. There was 7 in 2008, 11 in 2009 and 1 in 1980. I showed my teacher and he said that a bar graph wouldn’t be the best graph to do the years in so we suggested a pie graph. A pie graph is a bit trickier because you need to find out the angles of the people. Our teacher helped us make it and this is our pie graph.
To this